
Hi Everybody!!!!
As we witness the extreme Nature occurring on Earth in 2012, we wonder what is causing the increased activity of earthquakes and volcanoes? In my (simple) search I have found (too) many theories and ideas!!!
It is already Historical Record our collective Bankers, Governments, News Medias, and Scientists are not/have not and likely will not inform the People of the World the Truth about anything. It is deliberate to misinform, delay, distract, divide and deny.
So tonight a little pop quiz:
How many people know:
1) what space weather is?
2) what events happened on the sun?
3) there has been 405 earthquakes in the past 7 days?
4) there has been 12 active volcanoes from 9 19- 9 25?
5) that the Ice has melted super fast?
6) what post-glacial rebound is and what effects are happening to the tectonic plates?
You know that none of the above has been "front page news". And Why Not?
One Company rises above ALL in there efforts to bring people together for discussion and information sharing:
Our own Google!!! Thank You!!!!!!!
Now I do not know why an old lady (me) has to dig around looking for some things I know nothing about. I just wanted to find out what is happening to my birds, butterflies and fish here at my Bird Sanctuary. My winged guests are at record low numbers this year. My fish in Rainbow Creek are surfacing (dead). My big, old growth Oak Trees have burned leaf canopies and are dying. My pecan trees threw there nuts mid summer. My land is sinking toward the creek. The summer intense heat is still here and the weather everywhere is more whacked out than I am!!!
What is Happening to the Earth?
I have finally discovered something that makes sense. It is called post glacial rebound. I found some videos by: believersunderground (username on You Tube Site). I have shared them with you below on the Video LineUp.
His work is well researched and he posts the links, so you will be able to go to those links yourself. He has a different point of view and attitude, but I find his videos very creative and informative.
In addition, I have presented information from Wikipedia and NASA on this subject.
So you will find many things to look at tonight. Come back later if your eyes get too tired. I will have to go over this information many times to begin to understand it. It is very important where the melted ice went.

A model of present-day mass change due to post-glacial rebound
and the reloading of the ocean basins with seawater.
Blue and purple areas indicate rising due to the removal of the ice sheets
Yellow and red areas indicate falling as mantle material
moved away from these areas in order to supply
the rising areas, and because of the
collapse of the forebulges around the ice sheets.
Post-glacial rebound
From Wikipedia, the free encyclopedia
FEATURE PRESENTATION
+++++++++++++++++++++++++
Post Glacial Rebound Effect. sportydevil666 #7
https://www.youtube.com/watch?v=CGwj5sx0bJ0
Published on Sep 23, 2012 by believersunderground
calling all Ants, My gift has always been real. It's just science, you've been played. Not By Me Love Scott (BUG) with me God get's the glory. Save life can't go wrong with that
http://www.cybertribenetwork.com/
Truth Summit - YouTube Activists September 22-23, 2012.
New Network being Launched NOW! VIDEO MAKERS SIGN UP NOW FOR UPCOMING CONFERENCE!!
http://www.youtube.com/user/jjvallea99?feature=watch
Emergency Powers kobayashi maru Father LUVBUG
http://www.youtube.com/watch?v=u6qAzzNQZIg
post glacial rebound 2012
big problem with the numbers is, if they where constant. there not. with 24 secs. of slowing in the last 40 yrs. that kills that data. did you see the magnetic field change over that time frame. wow. Greenland is up over 2 feet. it's not looking good.
http://www.youtube.com/watch?v=ukoSA5i8CZ8&list=FLnRy49T93gIjEjdfc07-f6Q&...
Kobayashi Maru FALSE WORLD ORDER aka NWOI hehehehe
http://www.youtube.com/watch?NR=1&feature=endscreen&v=8N-H1lz3OJ4star... kobayashi maru
Constitution Lecture 9: Separation of Church and State
http://www.youtube.com/watch?v=lWBG8byqqUI
Where is Faith? God has always been with me. da GET THAT HATERS & false witnesses. GOD HAS A CAN OF WHOOP ASS FOR YOU
http://www.youtube.com/watch?v=ukoSA5i8CZ8&list=FLnRy49T93gIjEjdfc07-f6Q&...
14 Russian Nuclear Reactors Dumped in Artic ocean "Could reachieve criticality & explode"
http://www.youtube.com/watch?v=Ip8nhqFGCdA&feature=autoplay&list=FLnR...
US Dept clock. 4 billion a day to usury. makes your 501c3 gifts of 100 million a day. knoll and void! THINK. BUG
http://www.usdebtclock.org/
Better is a dry morsel, and quietness therewith, than an house full of sacrifices with strife. Whoso mocketh the poor reproacheth his Maker: and he that is glad at calamities shall not be unpunished.
The fining pot is for silver, and the furnace for gold: but the LORD trieth the hearts
Prov. 17
http://www.youtube.com/watch?v=bDg674aS-F4
Arctic ice melting at 'amazing' speed, scientists find.
http://www.youtube.com/watch?v=3EQHttaSBBc&list=FLnRy49T93gIjEjdfc07-f6Q&...
Oil Price Rise Because Of World Bank Buying Bad Bonds From Spain and Italy (Sept. 6, 2012) http://www.youtube.com/watch?v=kqW5nfIuhPs&list=FLnRy49T93gIjEjdfc07-f6Q&...
STARWATER - A Look at Our Changing Planet
http://www.youtube.com/watch?v=LiC-92YgZvQ&list=UUTiL1q9YbrVam5nP2xzFTWQ&...
$900,000,000,000,000 OTC WORLD CON $140,000 per person! THE WARNING pt 5/5 BUG http://www.youtube.com/watch?v=nYj5RpEoz_s&list=FLnRy49T93gIjEjdfc07-f6Q&...
Imminent Destruction of Earth Is Now Washing D. C. 2030 Report NASA dropped it to 2020 report http://www.youtube.com/watch?v=hnAylaafYrg&feature=related
http://www.youtube.com/watch?v=HXNZfghKyZI
Why Explained EXTREME WEATHER EVENTS & Post Glacial Rebound Effect
http://www.youtube.com/watch?v=OQs_-5mfkrI
B4 Volcano's Mega Earthquakes Flooding Post Glacial Rebound Effect .
http://www.youtube.com/watch?v=3-z4g7ixbgU&list=FLnRy49T93gIjEjdfc07-f6Q&...
Sounds, Chemtrail Web Blood, SkyQuakes, Earthquake Light's. Radio Show
http://www.youtube.com/watch?v=s0kxgI_SD-E
Permafrost Methane Time Bomb NBC News
http://www.youtube.com/watch?v=2w4UQfJHD-A
Scott Owen P.O.Box 657 Goshen Ca. 93227
NASA Fact Giant Breach in Earth's Magnetic Field
Post Glacial Rebound Effect.
https://www.youtube.com/watch?v=Y03pQ3Yd7G4
Uploaded by believersunderground on Jun 8, 2011
Cup of ice fraud! Post Glacial Rebound Nuclear Ice Cores chemtrails Scott Owen BDS CAS
http://www.youtube.com/watch?v=ycdfE3-bkXs&feature=channel_video_title
https://www.createspace.com/301016
http://www.youtube.com/user/Globaltruthnetwork1
Giant Breach in Earth's Magnetic Field Discovered
http://science.nasa.gov/science-news/science-at-nasa/2008/16dec_giantbreach/
CNN 3 Min. COP 15 Video Climate Summit 3?'s this is a end of the planet as we know it problem. just type in google search CNN Shield of Ra
Scientists at the Technische Universität (TU) Dresden have discovered massive post-glacial rebound in the Patagonian ice field at the southern tip of South America. Together with their colleagues from Chile and the USA, the researchers can prove the land is actually moving upward as the glaciers that once weighed it down melt away.
Using GPS technology, the Patagonia-based team measured the largest post-glacial rebound anywhere in the world thus far, an exact rate of 39 mm per year. Spanning more than 5,000 square miles, the southern Patagonian ice field is the worlds second largest ice mass in the southern hemisphere after Antarctica.
Two factors are coming together here, explains project manager Reinhard Dietrich from the Institute for Planetary Geodesy at the TU Dresden.
First the decrease of the ice, which began after the small ice age about 120 years ago which has now reached a major annual loss of 30 gigatons or about 30 cubic kilometers. This increasing loss of ice is clearly associated with climate change that has occurred over recent decades. Secondly, the lithosphere and earth mantle have the properties to compensate especially quickly for massive changes on the earths surface."
This compensation process is known by the scientific term glacial isostasy. The earth's crust sits atop a layer of very hot rock known as the mantle, which can stretch and flow under pressure. The weight of the glaciers once displaced some of the the mantle below, but as the ice melts away, the mantle is flowing back and pushing the crust upwards.
Mr. Owen BDS CAS CFDA Opportunity Number Comp. ID Grants.gov # Date/Time Received Status Status Date Submission Name
15.807 10HQPA0001 10HQPA0001 GRANT10318874 14-May-09 12:34:54 AM Validated 14-May-09 02:55:37 AM expanding ocean and earthquake impacts from post glacial rebound effect.
New USGS Study Documents Rapid Disappearance
of Antarcticas Ice Shelves
Possible Forecast for Continued Antarctica Glacier Loss scattering and absorbing radiation particle A in the chemtrails is nuclear!!! This is your Chemtrail gold mine. Love Scott (BUG)
Post Glacial Rebound Effect sshadowedpartss 6
https://www.youtube.com/watch?v=TfzuLJ4UaRcContinued Wikipedia Text From Following Link
Overviewhttp://en.wikipedia.org/wiki/Post-glacial_rebound

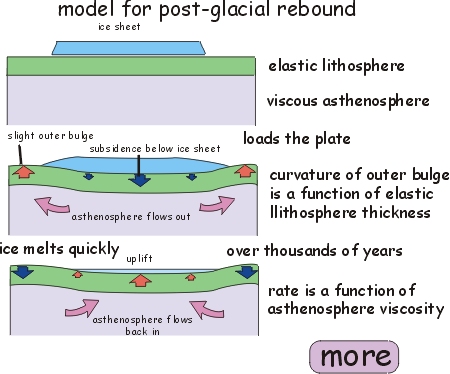
During the last glacial period, much of northern Europe, Asia, North America, Greenland andAntarctica were covered by ice sheets. The ice was as thick as three kilometres during the last glacial maximum about 20,000 years ago. The enormous weight of this ice caused the surface of the Earth's crust to deform and warp downward, forcing the viscoelastic mantle material to flow away from the loaded region. At the end of each glacial period when the glaciers retreated, the removal of the weight from the depressed land led to slow (and still ongoing) uplift or rebound of the land and the return flow of mantle material back under the deglaciated area. Due to the extreme viscosity of the mantle, it will take many thousands of years for the land to reach anequilibrium level.
Studies have shown that the uplift has taken place in two distinct stages. The initial uplift following deglaciation was near-instantaneous due to the elastic response of the crust as the ice load was removed. After this elastic phase, uplift proceeded by slow viscous flow so the rate of uplift decreased exponentially after that. Today, typical uplift rates are of the order of 1 cm/year or less. In northern Europe, this is clearly shown by the GPS data obtained by the BIFROST GPS network.[1] Studies suggest that rebound will continue for about at least another 10,000 years. The total uplift from the end of deglaciation depends on the local ice load and could be several hundred metres near the centre of rebound.
Recently, the term post-glacial rebound is gradually being replaced by the term glacial isostatic adjustment. This is in recognition that the response of the Earth to glacial loading and unloading is not limited to the upward rebound movement, but also involves downward land movement, horizontal crustal motion,[1][2] changes in global sea levels,[3] the Earth's gravity field,[4] induced earthquakes[5] and changes in the rotational motion.[6]
[edit]Effects
Post-glacial rebound (or glacial isostatic adjustment) produces measurable effects on vertical crustal motion, global sea levels, horizontal crustal motion, gravity field, Earth's rotational motion and state of stress and earthquakes. Studies of glacial rebound give us information about the flow law of mantle rocks and also past ice sheet history. The former is important to the study of mantle convection,plate tectonics and the thermal evolution of the Earth. The latter is important to glaciology, paleoclimate and changes in global sea level. Understanding postglacial rebound is also important to our ability to monitor recent global change.
[edit]Vertical crustal motion

Erratic boulders, U-shaped valleys, drumlins, eskers, kettle lakes, bedrock striations are among the common signatures of the Ice Age. In addition, post-glacial rebound has caused numerous significant changes to coastlines and landscapes over the last several thousand years, and the effects continue to be significant.
In Sweden, Lake Mälaren was formerly an arm of the Baltic Sea, but uplift eventually cut it off and led to its becoming a freshwater lake in about the 12th century, at the time when Stockholmwas founded at its outlet. Marine seashells found in Lake Ontario sediments imply a similar event in prehistoric times. Other pronounced effects can be seen on the island of Öland, Sweden, which has little topographic relief due to the presence of the very level Stora Alvaret. The rising land has caused the Iron Age settlement area to recede from the Baltic Sea, making the present day villages on the west coast set back unexpectedly far from the shore. These effects are quite dramatic at the village of Alby, for example, where the Iron Age inhabitants were known to subsist on substantial coastal fishing.
As a result of post-glacial rebound, the Gulf of Bothnia is predicted to eventually close up atKvarken. The Kvarken is a UNESCO World Natural Heritage Site, selected as a "type area" illustrating the effects of post-glacial rebound and the holocene glacial retreat.
In several other Nordic ports, like Tornio and Pori (formerly at Ulvila), the harbour has had to be relocated several times. Place names in the coastal regions also illustrate the rising land: there are inland places named 'island', 'skerry', 'rock', 'point' and 'sound'. For example, Oulunsalo"island of Oulujoki"[7] is a peninsula, with inland names such as Koivukari "Birch Rock",Santaniemi "Sandy Cape", and Salmioja "the ditch of the Sound". (Compare [1] and [2].)

In Great Britain, glaciation affected Scotland but not southern England, and the post-glacial rebound of northern Great Britain (up to 10 cm per century) is causing a corresponding downward movement of the southern half of the island (up to 5 cm per century). This will eventually lead to an increased risk of floods in southern England and south-western Ireland.[8]
Since the glacial isostatic adjustment process causes the land to move relative to the sea, ancient shorelines are found to lie above present day sea level in areas that were once glaciated. On the other hand, places in the peripheral bulge area which was uplifted during glaciation now begins to subside. Therefore ancient beaches are found below present day sea level in the bulge area. The “relative sea level data”, which consists of height and age measurements of the ancient beaches around the world, tells us that glacial isostatic adjustment proceeded at a higher rate near the end of deglaciation than today.
The present-day uplift motion in northern Europe is also monitored by a GPS network called BIFROST.[1][9][10] Results of GPS data shows a peak rate of about 11 mm/year in the north part of the Gulf of Bothnia, but this uplift rate decreases away and becomes negative outside the former ice margin.
In the near field outside the former ice margin, the land sinks relative to the sea. This is the case along the east coast of the United States, where ancient beaches are found submerged below present day sea level and Florida is expected to be submerged in the future.[3] GPS data in North America also confirms that land uplift becomes subsidence outside the former ice margin.[2]
Global sea levels
To form the ice sheets of the last Ice Age, water from the oceans evaporated, condensed as snow and was deposited as ice in high latitudes. Thus global sea level fell during glaciation.
The ice sheets at the last glacial maximum were so massive that global sea level fell by about 120 metres. Thus continental shelves were exposed and many islands became connected with the continents through dry land. This was the case between the British Isles and Europe, or between Taiwan, the Indonesian islands and Asia. A sub-continent also existed between Siberia and Alaska that allowed the migration of people and animals during the last glacial maximum.[3]
The fall in sea level also affects the circulation of ocean currents and thus has important impact on climate during the Ice Age.
During deglaciation, the melted ice water returns to the oceans, thus sea level in the ocean increases again. However, geological records of sea level changes show that the redistribution of the melted ice water is not the same everywhere in the oceans. In other words, depending upon the location, the rise in sea level at a certain site may be more than that at another site. This is due to the gravitational attraction between the mass of the melted water and the other masses, such as remaining ice sheets, glaciers, water masses and mantle rocks[3] and the changes in centrifugal potential due to Earth's variable rotation.[11]
[edit]Horizontal crustal motion
Accompanying vertical motion is the horizontal motion of the crust. The BIFROST GPS network[10] shows that the motion diverges from the centre of rebound.[1] However, the largest horizontal velocity is found near the former ice margin.
The situation in North America is less certain; this is due to the sparse distribution of GPS stations in northern Canada, which is rather inaccessible.[2]
[edit]Tilt
The combination of horizontal and vertical motion changes the tilt of the surface. That is, locations farther north rise faster, an effect that becomes apparent in lakes. The bottoms of the lakes gradually tilt away from the direction of the former ice maximum, such that lake shores on the side of the maximum (typically north) recede and the opposite (southern) shores sink. This causes the formation of new rapids and rivers. The effects are similar to that concerning seashores, but occur above sea level.
[edit]Gravity field
Ice, water and mantle rocks have mass, and as they move around, they exert a gravitational pull on other masses towards them. Thus, the gravity field, which is sensitive to all mass on the surface and within the Earth, is affected by the redistribution of ice/melted water on the surface of the Earth and the flow of mantle rocks within.[citation needed]
Today, more than 6000 years after the last deglaciation terminated, the flow of mantle material back to the glaciated area causes the overall shape of the Earth to become less oblate. This change in the topography of Earth's surface affects the long-wavelength components of the gravity field.[citation needed]
The changing gravity field can be detected by repeated land measurements with absolute gravimeters and recently by the GRACEsatellite mission.[12] The change in long-wavelength components of Earth's gravity field also perturbs the orbital motion of satellites and has been detected by LAGEOS satellite motion.[13]
[edit]Vertical datum
The vertical datum is a theoretical reference surface for altitude measurement and plays vital roles in many human activities, including land surveying and construction of buildings and bridges. Since postglacial rebound continuously deforms the crustal surface and the gravitational field, the vertical datum needs to be redefined repeatedly through time.
[edit]Earth's rotation
| This section may contain previously unpublished synthesis of published material that conveys ideas not attributable to the original sources. (March 2011) |
Examination of ancient Chinese and Babylonian eclipse records reveals[14] that the Earth’s rotation rate is not constant. For example, if the rotation rate were constant, then the shadow path of an ancient Babylonian eclipse would lie somewhere across western Europe and the ancient eclipse could not have been observed at the recorded time in Babylon. It is well known that tidal interaction between Earth and the Moon (tidal friction or tidal dissipation) causes the Earth's rotation to slow. But taking into account the tidal interaction alone over-corrects the eclipse path which would lie east of Babylon.[15] To have the shadow path pass through Babylon at the recorded time, we need[citation needed] to take into account the effect of glacial isostatic adjustment on Earth’s rotational motion.
To understand how glacial isostatic adjustment affects Earth's rotation rate, we note that the movement of mass on and beneath the Earth's surface affects the moment of inertia of the Earth; by the conservation of angular momentum, the rotational motion must also change. This is illustrated by a rotating ice skater: as she extends her arms above her head, her moment of inertia decreases, and she spins faster. On the other hand, as she extends her arms horizontally, her moment of inertia increases and her spin slows.
During glaciation, water is taken from the oceans, whose average position is nearer the equator, and deposited as ice over the higher latitudes closer to the poles, which is closer to the rotational axis. This causes the moment of inertia of the Earth–ice–water system to decrease and just like the rotating figure skater bringing her arms closer to her body, the earth should spin faster. During deglaciation, the melted ice water returns to the oceans – farther from the rotational axis – causing the Earth’s spin to slow down. The mantle rocks flow in a direction opposite to that of the water, but the rate is much slower. After the end of deglaciation, the dominant mass movement is from the return flow of the mantle rocks back to the glaciated areas at high latitude, making the shape of the Earth less oblate. This process would, in isolation, lead to an increase in the rotation speed of the Earth and therefore to a decrease of the length of day. Lambeck estimated that the isolated effect of post-glacial rebound on the length of the day would be a decrease of about 0.7 milliseconds per century.[16] This process of nontidal acceleration of the rotation of the earth is corroborated by observations of the satellite LAGEOS[13] and is generally attributed to glacial isostatic adjustment.[6]
In addition to the changes in the Earth's rotation rate, the changes in the moment of inertia due to glacial isostatic adjustment[17] also cause the rotational axis to move from the current position near the North Pole[clarification needed] towards the center of the ice masses at glacial maximum (polar wander); thus it is moving[clarification needed] towards eastern Canada at a rate of about 1 degree per million years.[6][18]
This drift of the Earth's rotational axis in turn affects the centrifugal potential on the surface of the earth, and thus also affects sea levels.[11]
[edit]State of stress and intraplate earthquakes
According to the theory of plate tectonics, plate-plate interaction results in earthquakes near plate boundaries. However, large earthquakes are found in intraplate environment like eastern Canada (up to M7) and northern Europe (up to M5) which are far away from present-day plate boundaries. An important intraplate earthquake was the magnitude 8 New Madrid earthquake that occurred in mid-continental USA in the year 1811.
Glacial loads have provided more than 30 MPa of vertical stress in northern Canada and more than 20 MPa in northern Europe during glacial maximum. This vertical stress is supported by the mantle and the flexure of the lithosphere. Since the mantle and the lithosphere continuously respond to the changing ice and water loads, the state of stress at any location continuously changes in time. The changes in the orientation of the state of stress is recorded in the postglacial faults in southeastern Canada.[19] When the postglacial faults formed at the end of deglaciation 9000 years ago, the horizontal principal stress orientation was almost perpendicular to the former ice margin, but today the orientation is in the northeast-southwest, along the direction of seafloor spreading at the Mid-Atlantic Ridge. This shows that the stress due to postglacial rebound had played an important role at deglacial time, but has gradually relaxed so that tectonic stress has become more dominant today.
According to the Mohr–Coulomb theory of rock failure, large glacial loads generally suppress earthquakes, but rapid deglaciation promotes earthquakes. According to Wu & Hasagawa, the rebound stress that is available to trigger earthquakes today is of the order of 1 MPa.[20] This stress level is not large enough to rupture intact rocks but is large enough to reactivate pre-existing faults that are close to failure. Thus, both postglacial rebound and past tectonics play important roles in today's intraplate earthquakes in eastern Canada and southeast USA. Generally postglacial rebound stress could have triggered the intraplate earthquakes in eastern Canada and may have played some role in triggering earthquakes in eastern USA including the New Madrid earthquakes of 1811.[5] The situation in northern Europe today is complicated by the current tectonic activities nearby and by coastal loading and weakening.
[edit]Recent global warming
Recent global warming has caused mountain glaciers and the ice sheets in Greenland and Antarctica to melt and global sea level to rise. Therefore, monitoring sea level rise and the mass balance of ice sheets and glaciers allows us to understand more about global warming.
Recent rise in sea levels has been monitored by tide gauges and Satellite Altimetry (e.g. TOPEX/Poseidon). In addition to the addition of melted ice water from glaciers and ice sheets, recent sea level changes are also affected by the thermal expansion of sea water due to global warming, sea level change due to deglaciation of the last Ice Age (postglacial sea level change), deformation of the land and ocean floor and other factors. Thus, to understand global warming from sea level change, one must be able to separate all these factors, especially postglacial rebound, since it is one of the leading factors.
Mass changes of ice sheets can be monitored by measuring changes in the ice surface height, the deformation of the ground below and the changes in the gravity field over the ice sheet. Thus ICESat, GPS and GRACE satellite mission are useful for such purpose.[21]However, glacial isostatic adjustment of the ice sheets affect ground deformation and the gravity field today. Thus understanding glacial isostatic adjustment is important in monitoring recent global warming.
One of the possible impacts of global warming-triggered rebound may be more volcanic activity in previously ice-capped areas such as Iceland.[22]
[edit]Applications
The speed and amount of postglacial rebound is determined by two factors: the viscosity or rheology (i.e., the flow) of the mantle, and the ice loading and unloading histories on the surface of Earth.
The viscosity of the mantle is important in understanding mantle convection, plate tectonics, dynamical processes in Earth, the thermal state and thermal evolution of Earth. However viscosity is difficult to observe because creep experiments of mantle rocks take thousands of years to observe and the ambient temperature and pressure conditions are not easy to attain for a long enough time. Thus, the observations of postglacial rebound provide a natural experiment to measure mantle rheology. Modelling of glacial isostatic adjustment addresses the question of how viscosity changes in the radial[3][23][24] and lateral directions[25] and whether the flow law is linear or nonlinear.[26]
Ice thickness histories are useful in the study of paleoclimatology, glaciology and paleo-oceanography. Ice thickness histories are traditionally deduced from the three types of information: First, the sea level data at stable sites far away from the centers of deglaciationgive an eastimate of how much water entered the oceans or equivalently how much ice was locked up at glacial maximum. Secondly, the location and dates of terminal moraines tell us the areal extent and retreat of past ice sheets. Physics of glaciers gives us the theoretical profile of ice sheets at equilibrium, it also says that the thickness and horizontal extent of equilibrium ice sheets are closely related to the basal condition of the ice sheets. Thus the volume of ice locked up is proportional to their instantaneous area. Finally, the heights of ancient beaches in the sea level data and observed land uplift rates (e.g. from GPS or VLBI) can be used to constrain local ice thickness. A popular ice model deduced this way is the ICE5G model.[27] Because the response of the Earth to changes in ice height is slow, it cannot record rapid fluctuation or surges of ice sheets, thus the ice sheet profiles deduced this way only gives the "average height" over a thousand years or so.[28]
Glacial isostatic adjustment also plays an important role in understanding recent global warming and climate change.
Post-Glacial rebound measured at CBN stations
Repeated GPS observations at Canadian base network stations have permitted the detection of vertical uplift.

Source
http://www.google.com/imgres?imgurl=http://www.see.leeds.ac.uk/structure/dynamicearth/plates/rebound.jpg&imgrefurl=http://www.see.leeds.ac.uk/structure/dynamicearth/plates/rebound.htm&h=374&w=450&sz=69&tbnid=bYIMOAlxqELBiM:&tbnh=90&tbnw=108&zoom=1&usg=__xwJhR5v8w8F0TBGUq_cxiqbU9JU=&docid=jGi8_5BJSX7ooM&hl=en&sa=X&ei=RwZmUPXpD8ng2QX5lICYBg&sqi=2&ved=0CDoQ9QEwBA&dur=1186
FOR MORE INFORMATION
Scholarly articles for post glacial rebound … mantle convection and post‐glacial rebound data - Forte - Cited by 108 Post‐glacial rebound and asthenosphere viscosity in … - Sigmundsson - Cited by 84 Horizontal motions due to post‐glacial rebound - James - Cited by 48
A NASA REPORT
http://grace.jpl.nasa.gov/data/pgr/
|


The following You Tube Videos review the Global Melting Ice trend we have seen (intensely) from July to September 2012. (NOW).
GREENLAND
http://www.youtube.com/watch?v=eVP3IYqmKe4
ARTIC
http://www.youtube.com/watch?v=7HdyCm8on74
http://www.youtube.com/watch?v=CSOXxcR6KEA
NORTH AMERICA
http://www.youtube.com/watch?v=4QuTPfcKKd8
HIMALAYAS
http://www.youtube.com/watch?v=RYQyzvHsl4s
ICELAND
http://www.youtube.com/watch?v=HPaxDVxyZGs
ANTARCTICA
http://www.youtube.com/watch?v=yK6HQmJaSM0
SOUTH AMERICA
http://www.youtube.com/watch?v=9FMpocnivqM
......this is brendasue signing off from Rainbow Creek. See You Next Time.
Peace Be With You.
Of course, one more great performance (on the lighter side!) just push play
http://www.youtube.com/watch?v=WHmF1G8AyWY
O+O
No comments:
Post a Comment
Hi Everybody! Please say hello and follow so I know you are here! Due to the inconsideration of people trying to put commercials on my blog comment area, I have restricted use of anonymous posts. Sorry that some hurt all.
My public email is katescabin@gmail.com No spammers or trolls